Easy as Py: EEG data analysis with EEGrunt
If you’ve read previous articles on this blog, you know that we have a hankering for amateur neuroscience and have been doing some EEG experiments with the OpenBCI.

At first, we used the OpenBCI app. Next we experimented with BrainBay and OpenViBE, two popular applications for real-time EEG processing and display. However, we ran into a variety of shortcomings with these VPL applications, and when it came time to analyze the data from our Binaural Beats experiment, we knew we needed a more flexible and capable solution.
The talented Chip Audette, after switching from MATLAB to Python for his EEG experiments, helpfully open-sourced IPython notebooks from a number of his experiments. For the analysis of the first binaural beats trial we ran, Adam used pieces of Chip’s code to make an IPython notebook for our experiment. However, both Chip’s and our initial notebooks were experiment-specific and did not easily lend themselves to reuse.
Knowing that we would be doing more experiments in the future, and that when we posted the results our experiment it was important to make it easy for others to replicate, I took the code out of IPython and worked on making it more modular, adaptable, and easy to use.
What is EEGrunt?!
EEGrunt is a collection of Python EEG analysis utilities for OpenBCI and Muse.
The EEGrunt class has methods for data filtering, processing, and plotting, and can be included in your own Python scripts. The imaginatively titled demo script, analyze_data.py, includes example code for most of EEGrunt's current functionality — loading data from Muse or OpenBCI, filtering, and generating plots and spectrograms.
Update (September 2016): EEGrunt can now analyze ECG (electrocardiography) data as well, and plot heart rate and heart rate variability. We’ve posted a new tutorial to get you started: EEGrunt update: Analyze heart rate and HRV with Python.
Getting Started with EEGrunt
First, download EEGrunt. Or, if you use git, clone it with:
git clone https://github.com/curiositry/EEGrunt.git
Install Dependencies
Installing dependencies can be a hassle, so I put all EEGrunt’s dependencies in one bash script which should Just Work™ (at least on linux systems):
sudo bash install_linux_dependencies.sh
There’s a good chance this will work on Mac and other unix like systems, too. If you’re using Windows, Anaconda seems to be the recommended way to get up and running with scientific python.
If you have any issues with this step, send a tweet, email, or carrier pigeon my way and I’ll see what I can do.
Load some Data
Open analyze_data.py with your favourite text editor (be that Vim, Emacs, Notepad, or maybe … Microsoft Word?). There are three things you need to specify for EEGrunt to work: the device the data was recorded with, the path to where your data is stored, and the filename of the data.
The first ~27 lines of analyze_data.py look like this by default:
import EEGrunt

# Required settings

# Data source. Options:
# 'openbci' for data recorded with OBCI GUI;
# 'openbci-openvibe' for OBCI data recorded with OpenViBE's csv writer
# 'muse' for data from Muse headset
source = 'openbci'

# Path to EEG data file
path = 'data/'

# EEG data file name
filename = 'eegrunt-obci-ovibe-test-data.csv'

# Session title (used in plots and such)
session_title = "OpenBCI EEGrunt Test Data"

# Initialize
EEG = EEGrunt.EEGrunt(path, filename, source, session_title)


# Here we can set some additional properties
# The 'plot' property determines whether plots are displayed or saved.
# Possible values are 'show' and 'save'
EEG.plot = 'save'
It should be reasonably self explanatory. Currently, EEGrunt supports three values for source: openbci, for OpenBCI data recorded with the OpenBCI GUI (csv data, .txt file extension); openbci-openvibe, for OpenBCI data recorded with OpenViBE (.csv file extension); and muse, for data from the Muse headset, in .csv format. Set the source variable to match the device you used to record your data.
The path variable is set to data/ be default. Either create a directory in EEGrunt called data and place your recordings in it, or edit the path variable to point to where you’ve stockpiled your EEG recordings.
Set the filename variable to the name of the data file you want to analyze.
Optionally, set the session_title variable (to something like “OpenBCI data from OpenViBE SSVEP Session”). This is used in the labels of some of the plots, but is not essential, it if it’s not provided the plots will be labelled with the device and data filename.
Crunch some numbers
Run the script with:
python analyze_data.py
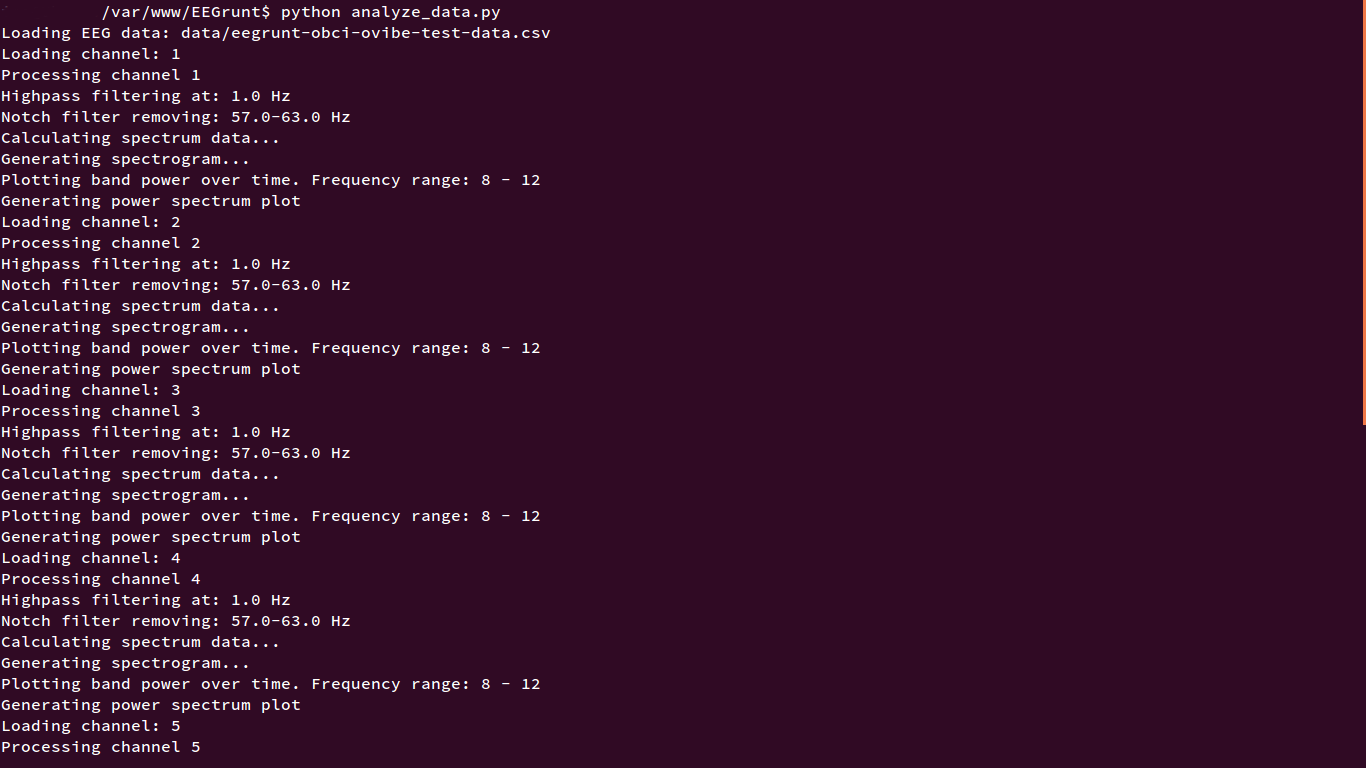
It should let you know more-or-less what’s going on — printing the filtering and plotting it’s doing to the console. By default, analyze_data.py does the following:
- Imports EEGrunt
- Sets basic variables (path, filename, etc.)
- Creates an EEGrunt object called EEG
- Sets some optional settings variables
- Calls EEGrunt’s
load_data()function - Loops through the channels array, and for each channel:
- Sets channel data with load_channel() function
- Filters out 60Hz mains interference and runs a 1Hz highpass filter to remove DC components of the signal
- Calculates spectrum data for the channel and stores it for future use
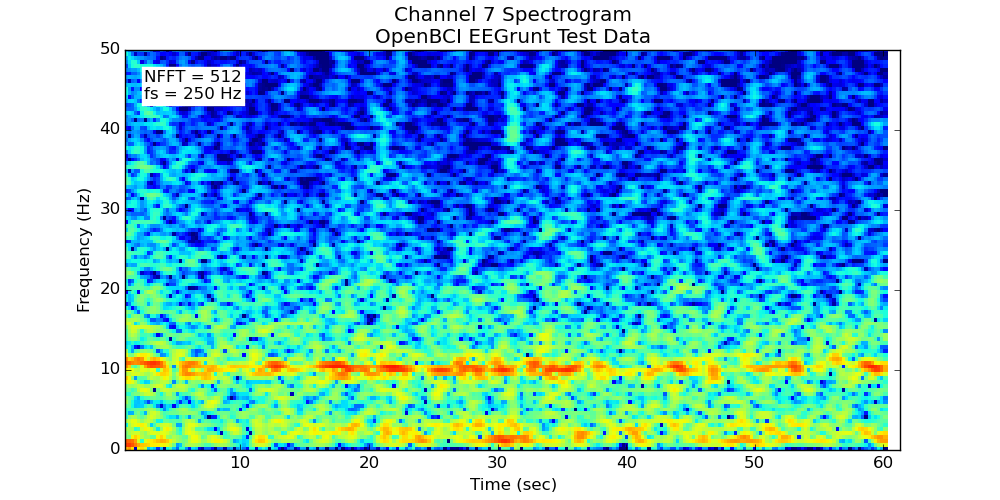
- Makes a spectrogram of the channel
- Plots amplitude over time for a particular frequency range (alpha, or 8–12Hz, by default)
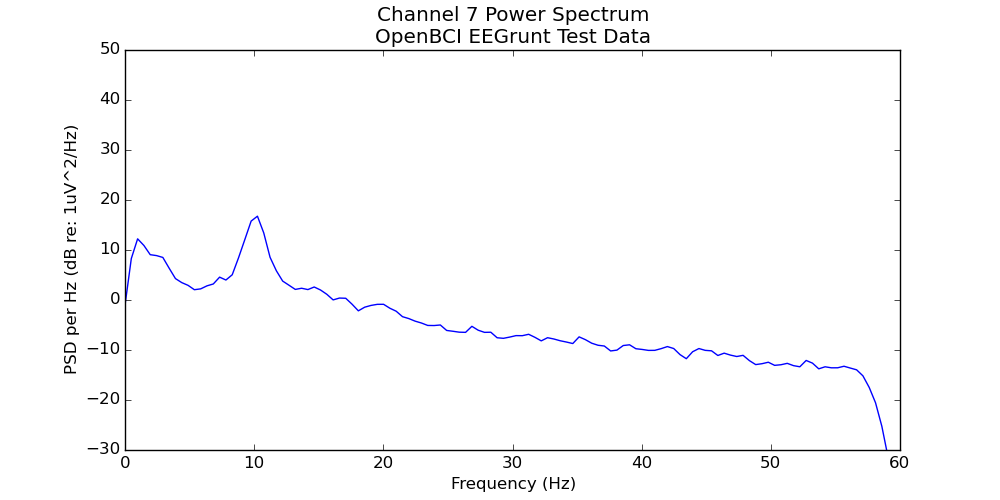
- Creates a power spectrum plot (average power at each frequency)
- Exits gracefully (if all goes well)
By default the plots will show as they’re generated, and the next one will only be processed once you’ve closed the current plot: set EEG.plot = 'save' and it will do just that — saving the whole batch in the plots folder for future enjoyment.
The demo script, analyze_data.py, is intended as an example of the things you can do with EEGrunt: edit it to suit your needs.
Conclusion
Once you’ve gotten going, you can write your own methods for EEGrunt (and submit a pull request to have them included), try out the other plotting functions, use the bandpass filter, or adjust the more detailed settings in EEGrunt’s init function.
If you have any issues, leave a comment below, submit an issue on github, ask a question on NeuroBB, or reach out on Twitter. Thanks for reading!